Using flowchart problems can be designed as per the requirement before actually creating a program. A flowchart is the best way to break down the problem into a basic piece, which further can be converted into a complete program. A Flowchart can be drawn in different ways. Simple flowchart uses sequential steps, ie, A flow of flowchart is in a continuous manner or from up to down approach. But sometimes the use of structured flowchart is necessary. There are various ways of preparing structured flowchart like by using Condition, Case or For loop. The flowchart that uses a for loop is for loop flowchart.
Before getting into flowchart loop, let’s first understand what loop exactly is in programming. Sequential programming is not an efficient way of writing a program, sometimes execution of a program may need to be repeated. For instance, if you want to print “Hello World” for 100 times you needs to repeat the statement that prints “Hello World” 100 times, now writing the statement 100 times, i.e. 100 lines is not practical, instead we use a loop to repeat the single statement 100 times. Now there are different types of a loop you can use to repeat the process, but some commonly used looping types are, for and WHILE WEND.
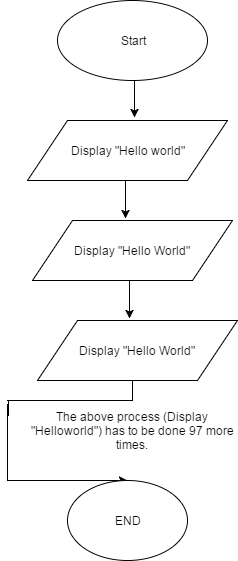
Let’s see how you would draw a flowchart to print “hello world” 100 times without using loop structure.
For loop flowchart
In above figure,  has to be repeated 97 more times, Which is not practical.
Now let’s try to use flowchart loop to solve the issue.
Equivalent C code:

for(i = 1; i <= 100; i++) {

    printf(“Hello World”);

}
Above we used for loop flowchart structure. Now everything is about simple logic. We initialize a 1 to variable “I” (I = 1), we check whether the value of variable has reached 100 or not ( is I < = 100 ?) , if the value of counter variable is less than or equal to 100 ( if yes), we print “Hello World”, increase the value of variable by 1 ( i.e I = i+1) and we check the condition again, and the process repeats until the value of variable a reaches 100. When the value of “I” becomes 101, the condition ( is i< = 100 ?) becomes false (NO) so, the flow of flowchart is directed towards “end” and the flowchart terminates. By the time “I” becomes 100, “hello world” would have printed 100 times.
Structure of For Loop Flowchart
Flowchart for sum of n numbers
Here in this an example, we will see how to draw a flowchart to find the sum of any “n” numbers. Since “n” is unknown, it has to be taken as input from the user.
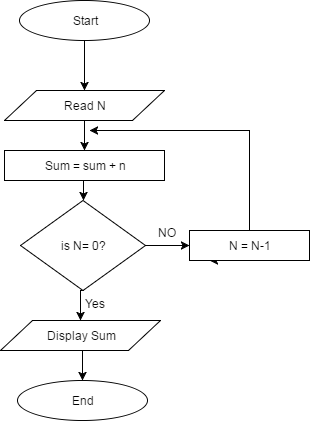
So let’s break it down. First, we read the value of “n”. Then we add the value of “n” to the variable sum( whose value is 0 initially, since we haven’t initialized any value in it), now we check whether the value of “n” has reached “0” (our logic is to start from “n” and go on decreasing the value by 1 and add the new value of “n” to sum until it becomes 0). Now there are two possible cases.
Case I: Yes( the value of “n” has reached 0): In this case, the “sum” already has the sum of numbers from “n” to 1. So, next step is to print the display the result.
Case II: NO( the value of “n” is still > 0): In this case we decrease the value of “n” by 1, and add it’s new value to sum(sum = sum+n) and the steps continue until the value of n becomes 0.

